If you’re trying to identify patterns or trends in a data set, you can use the three measures of central tendency–mean, median, and mode. These values can help you to see which direction the information leans in, and you can draw inferences (or make conclusions) about your data.
Check out this video to learn more:
What are mean, median, and mode?
The mean is the average of a set of values. If you add up all of the values and then divide this sum by the number of values, this will give you the mean.
The median refers to the central value. If you order your data set from least to greatest or vice versa, the median is the middle number in your list. (If you have an even data set, then average the two middle values to find the median).
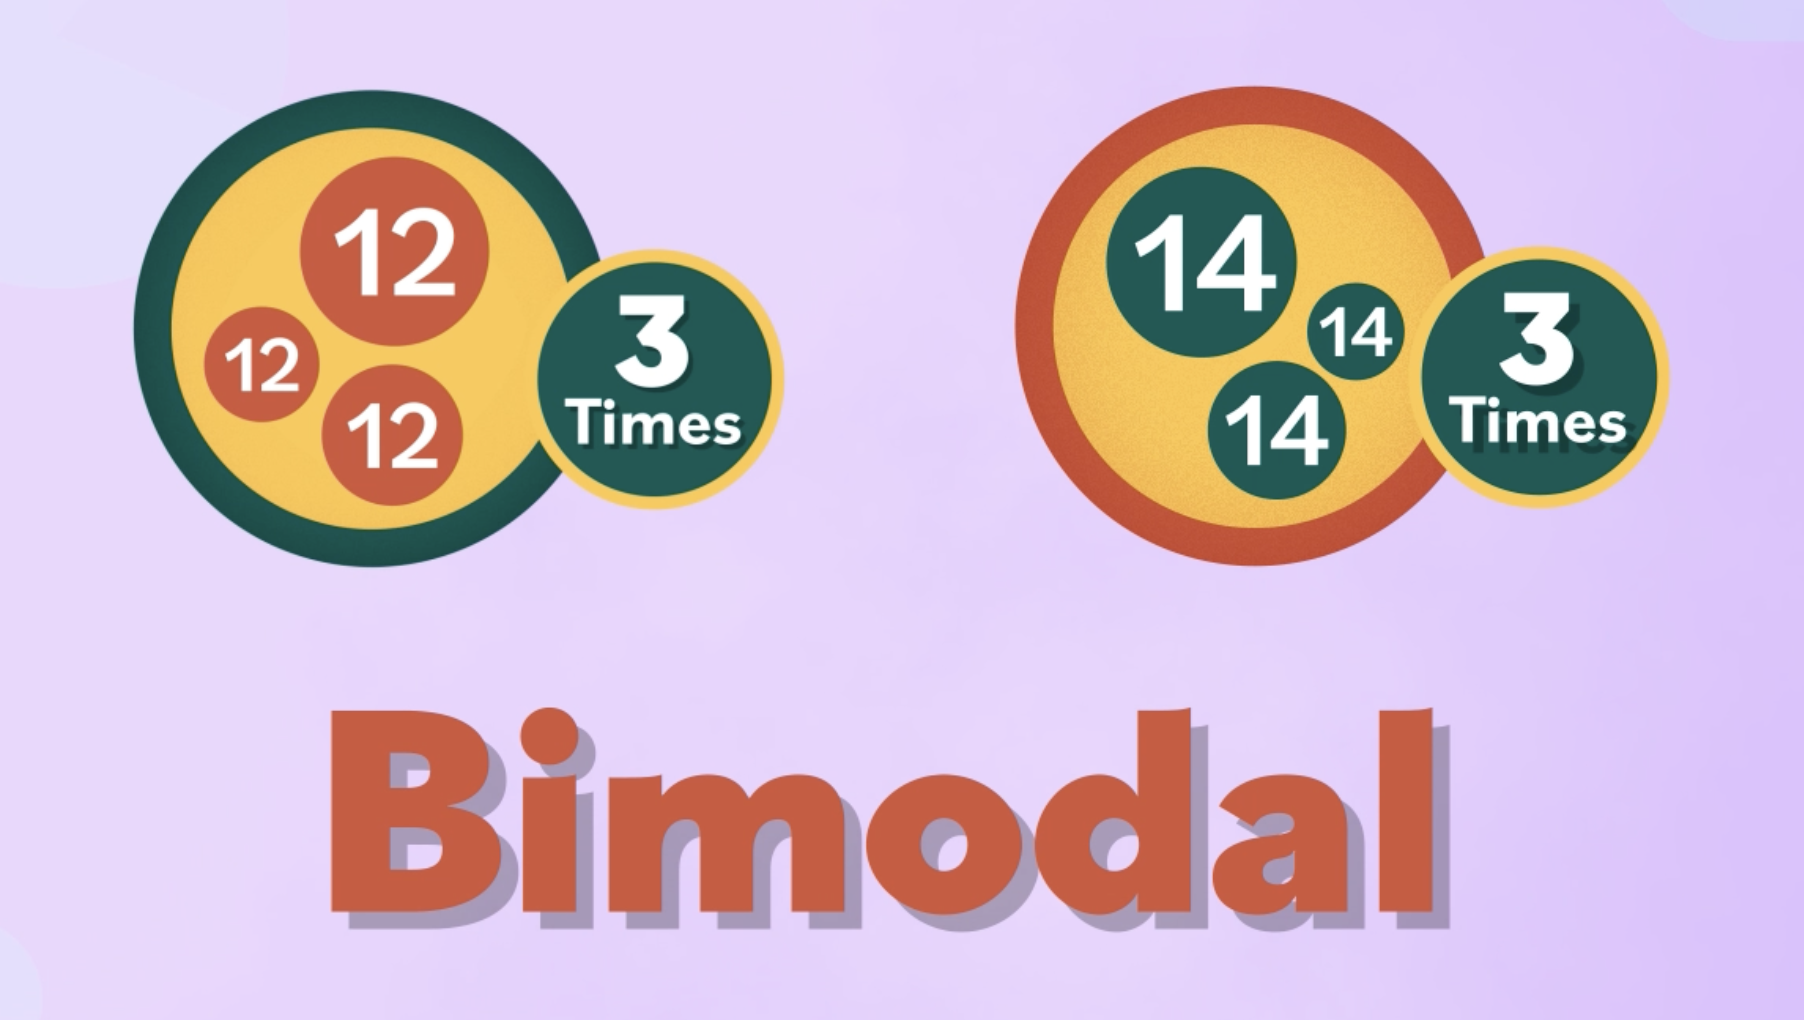
The mode refers to the value that’s repeated most often. If there are two values repeated more than the others, but an equal number of times, then you have a bimodal data set.
A real-world example
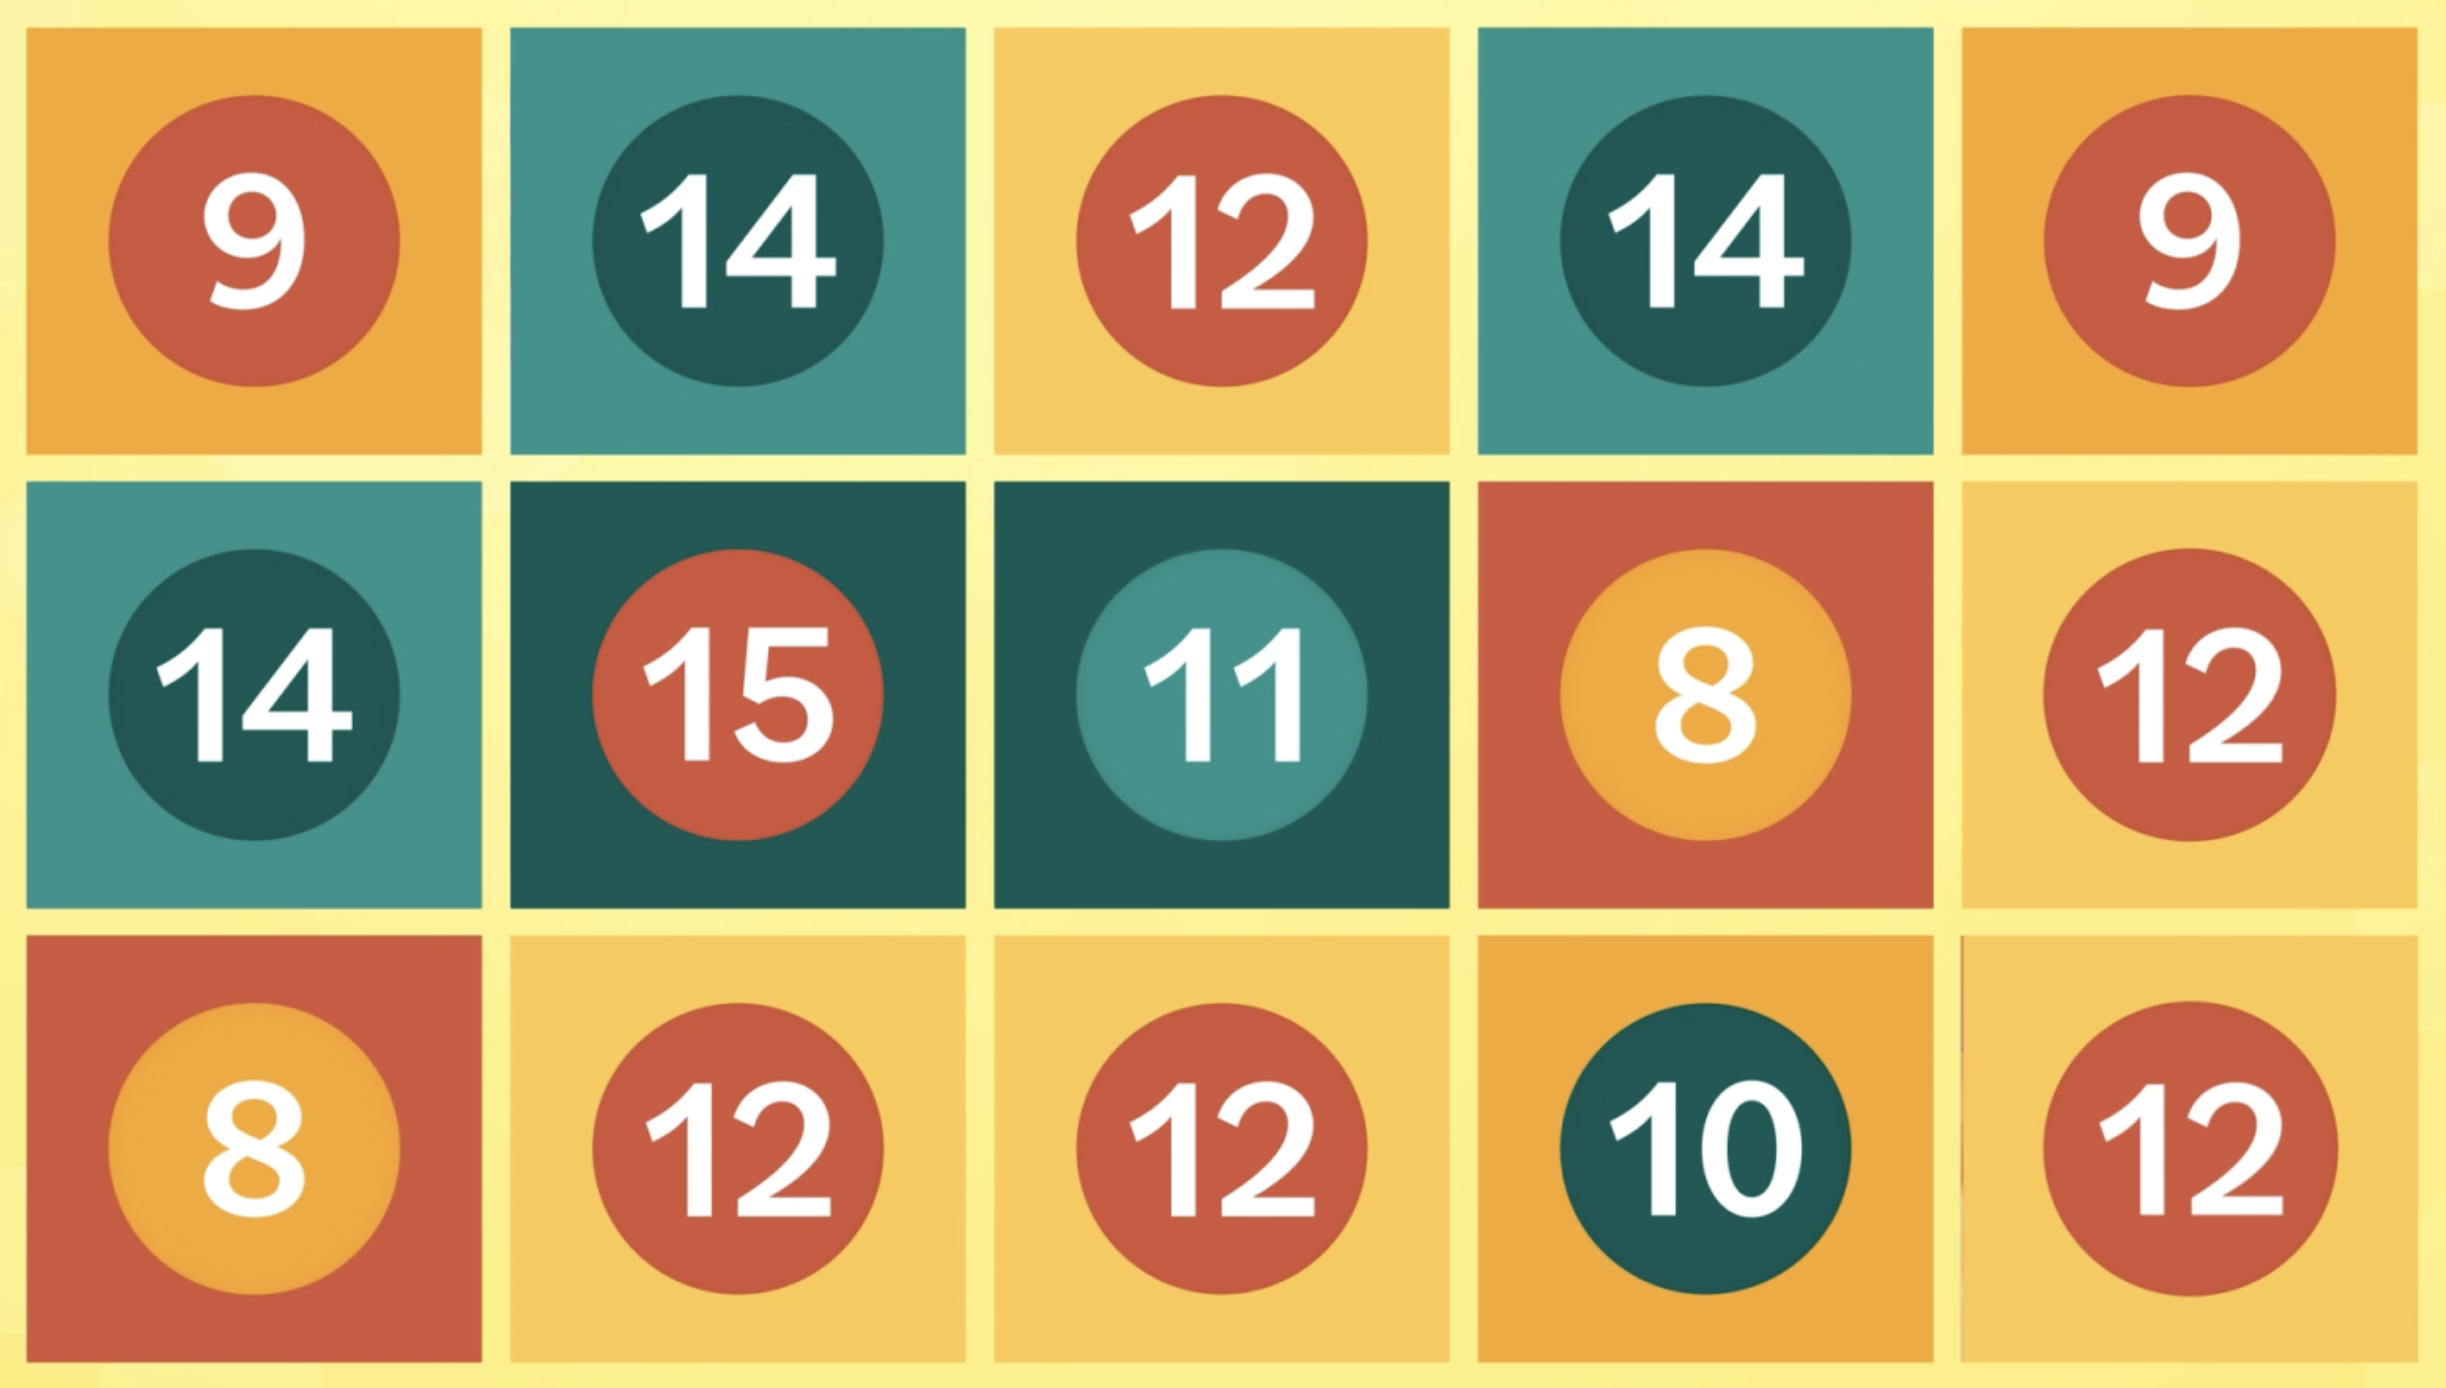
There are 15 children in a choir, and their ages vary greatly.
Let’s try to find the mean, median, and mode…
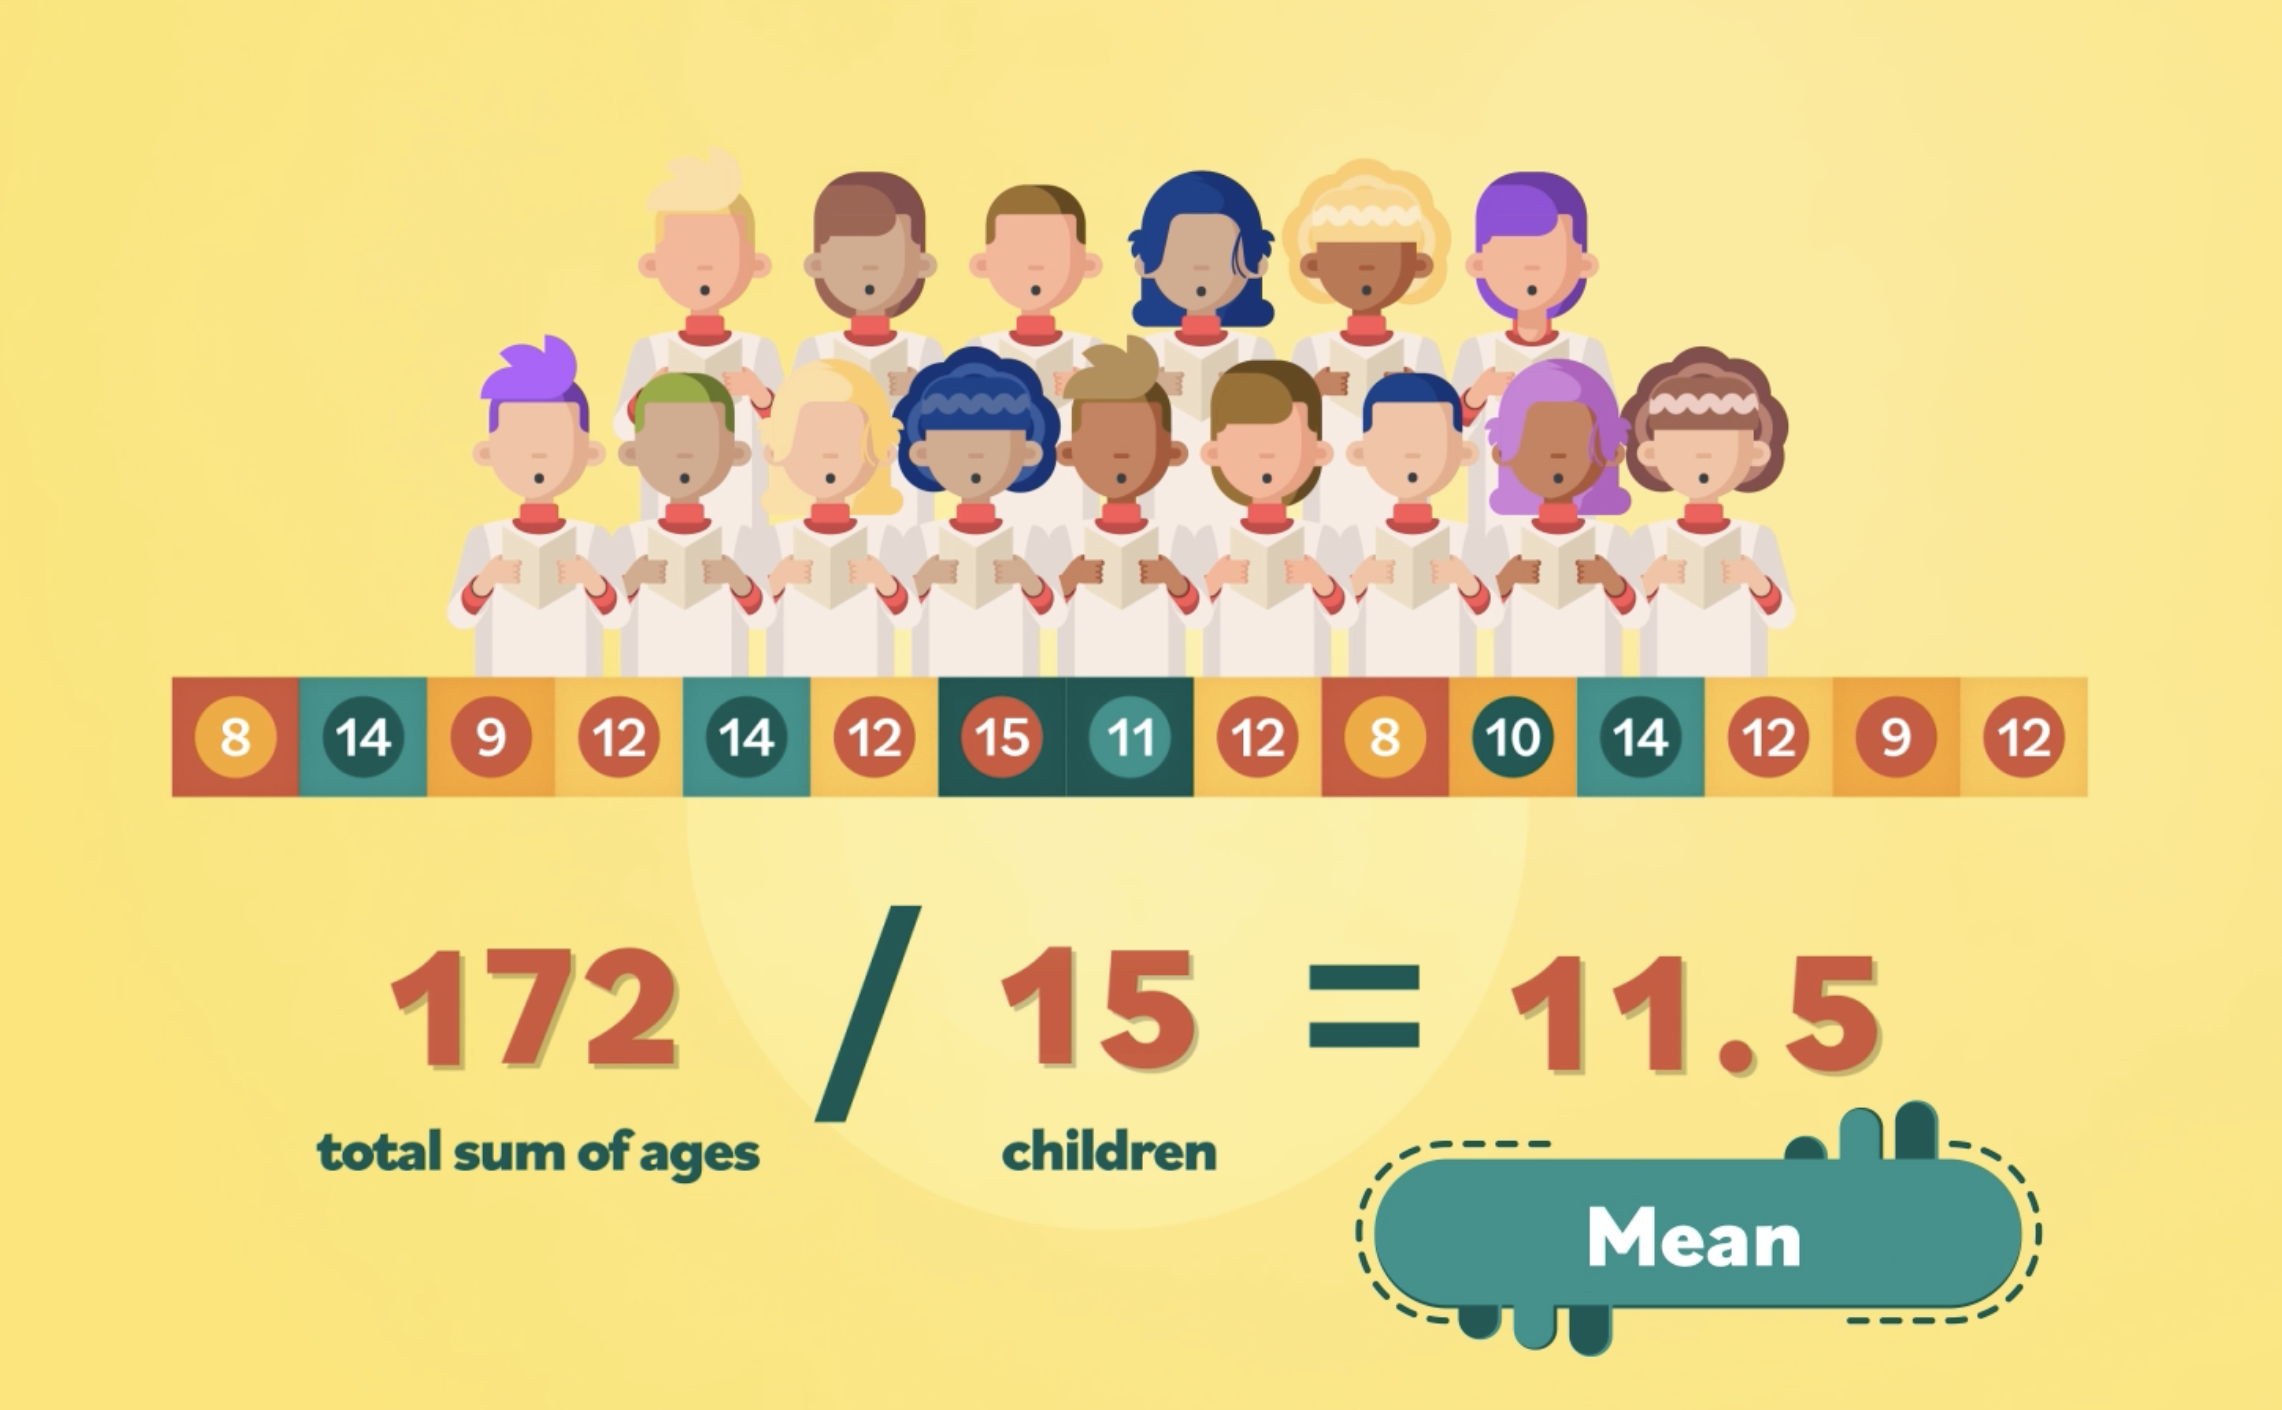
Step 1: The mean is calculated by adding up all of their ages, and then dividing the sum by the number of kids. If the number is a decimal, let’s round up to the nearest tenth.
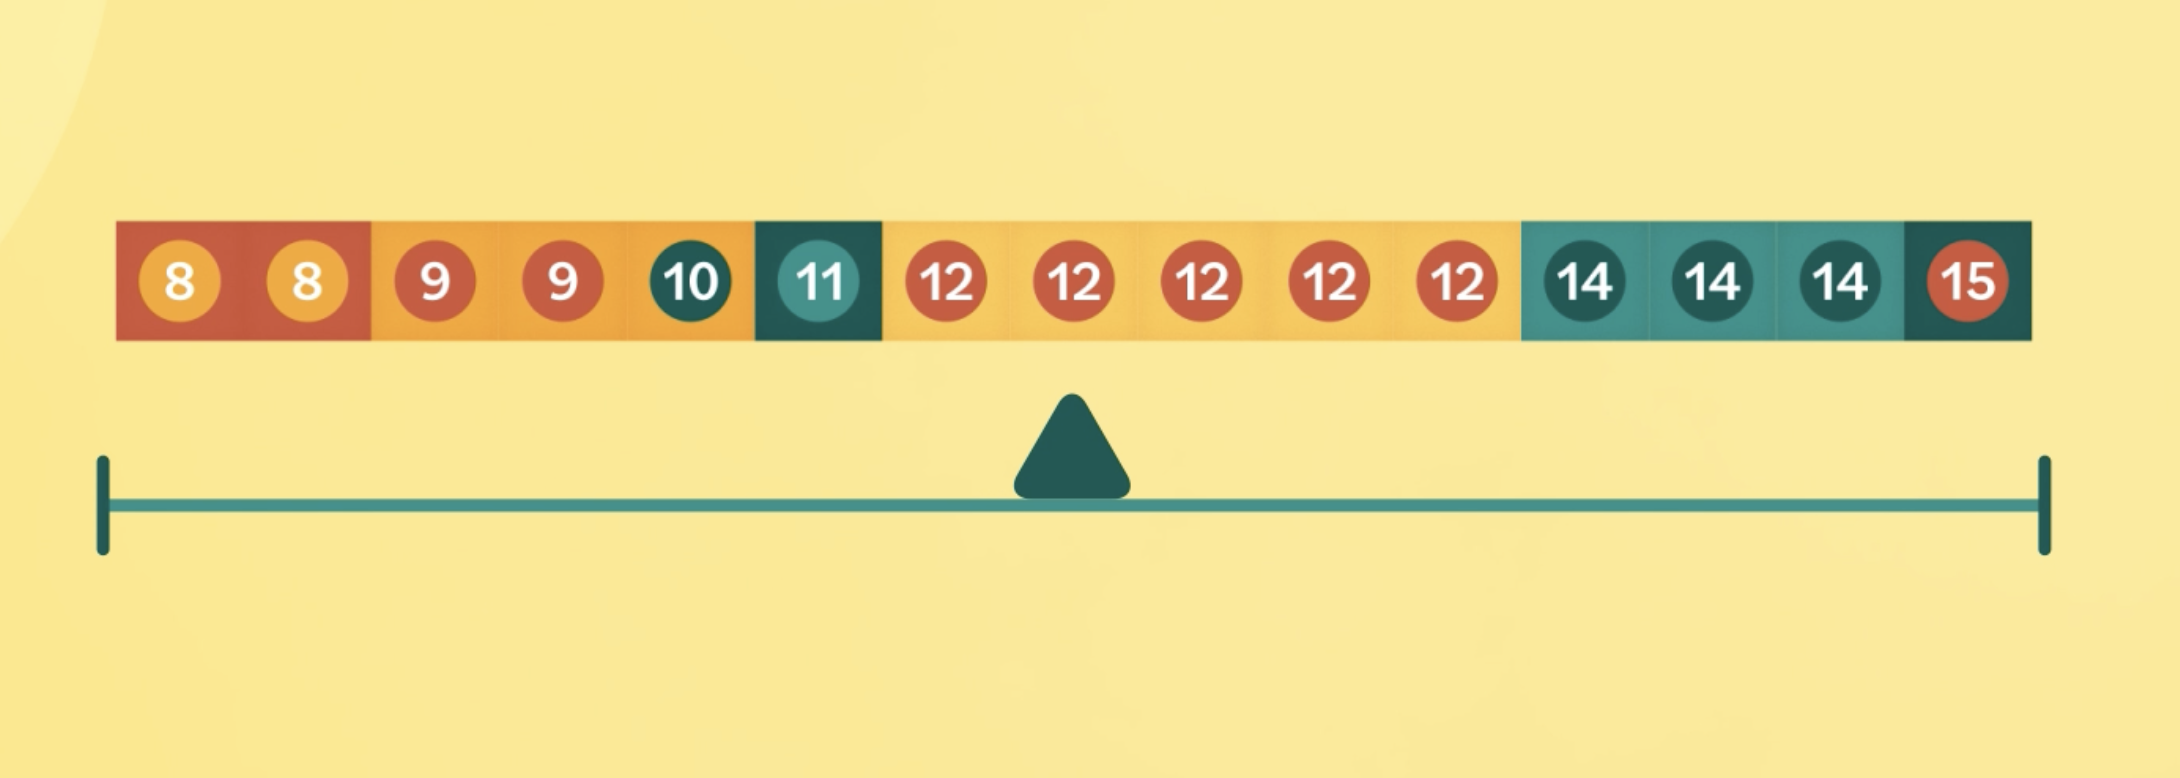
Step 2: In order to calculate the median, let’s order the values from least to greatest. Since we have an odd data set (with 15 values in total), it should be easy to identify the middle value.
In this case, we can see that the median is 12.
If you have an even data set, then average the two middle numbers to find the median. It’s okay if you end up with a decimal.
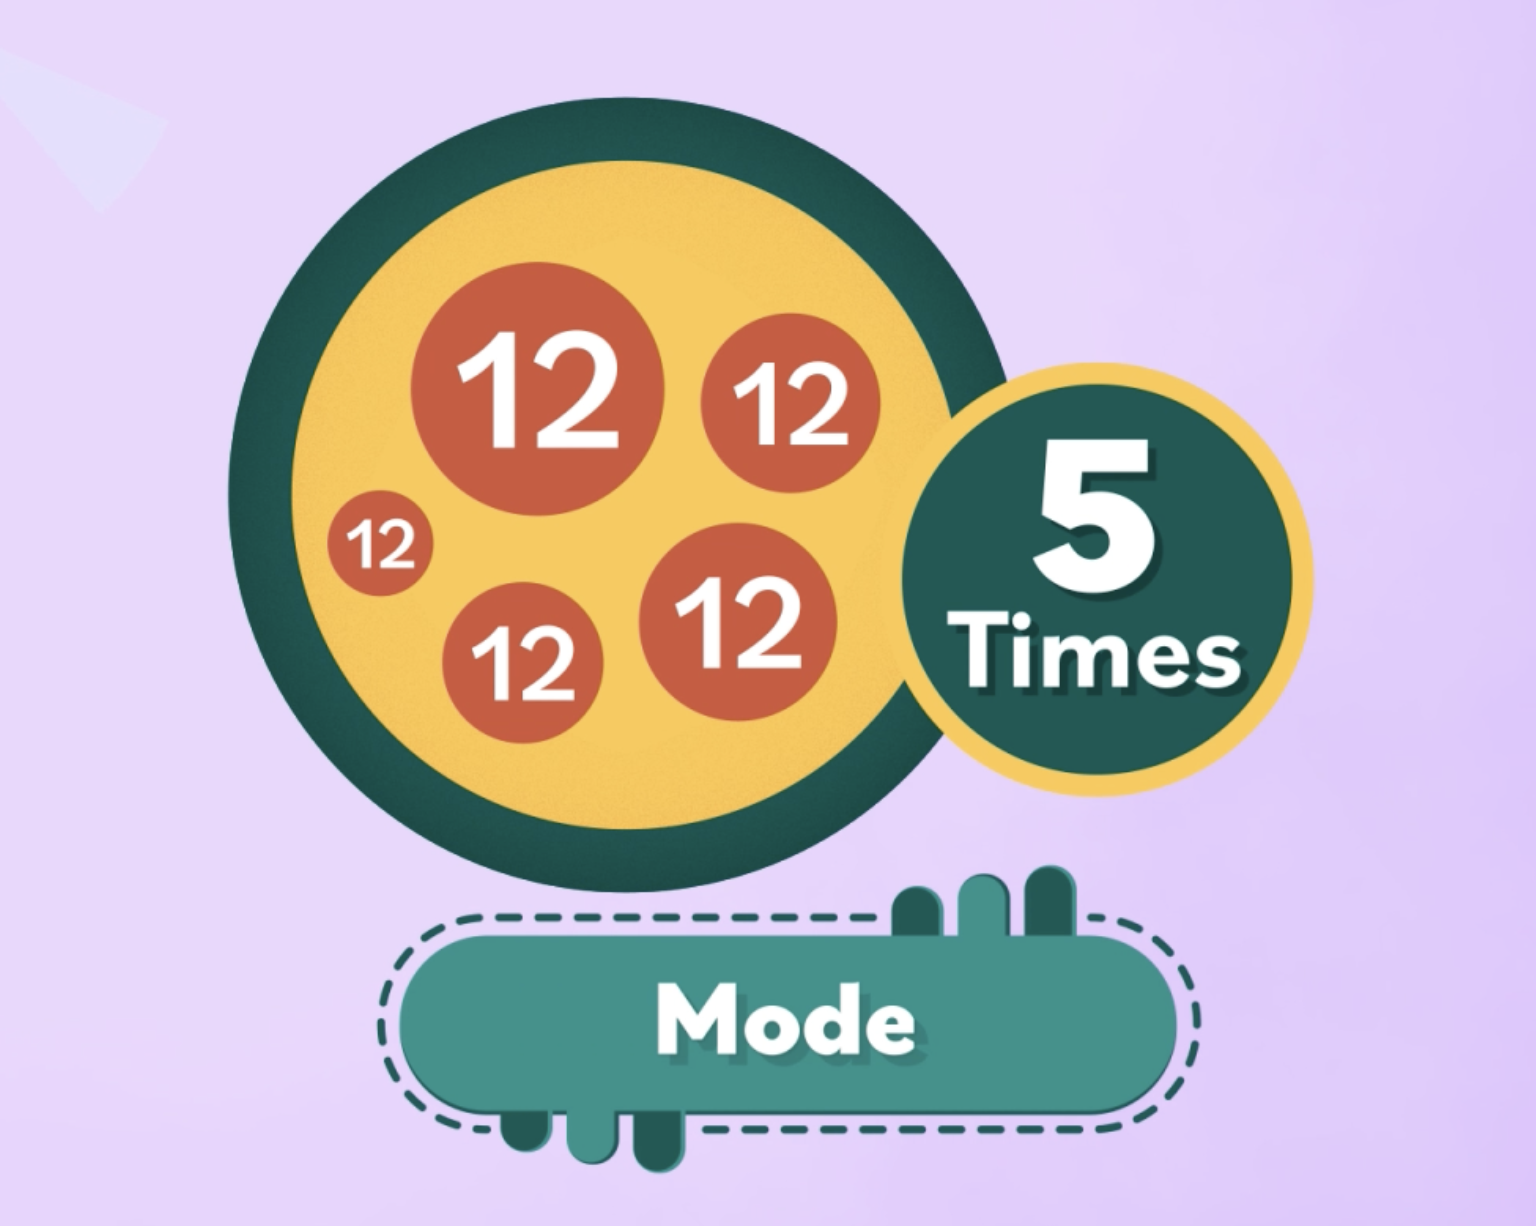
Step 3: Which number is repeated the most often? Since 12 is repeated five times, this makes it the mode.
Remember: If you have two modes, or two values repeated an equal number of times, then you have a bimodal data set. (If you have more than two modes, this is called a multimodal data set).
The three measures of central tendency provide different ways of summarizing and describing a set of data. In other words, they can help you to gain a more complete understanding of the data’s distribution.