Lesson 4: Frequency Tables
/en/statistics-basic-concepts/variables/content/
Frequency tables
A frequency table shows a set of values and assigns a frequency to each of them. In other words, how often does each value occur?
You can use frequency tables to organize quantitative or qualitative data, though they are more commonly used for data with qualitative variables.
Types of frequency
- Absolute frequency refers to how many times a number is repeated in a data set.
- The absolute cumulative frequency can be calculated by adding each frequency to the sum of the frequencies that come before it in the table.
- Relative frequency corresponds to how many times a number is repeated in a data set with respect to the total, expressed in percentages (%).
- The cumulative relative frequency is the sum of the relative frequencies.
How to create a frequency table
Let's take a look at an example. A biology teacher gave a quiz to the 20 students in her class. Each of the students received a score out of 10, and she wants to show them how well they performed overall, as a group.
Here are the steps to build a frequency table…
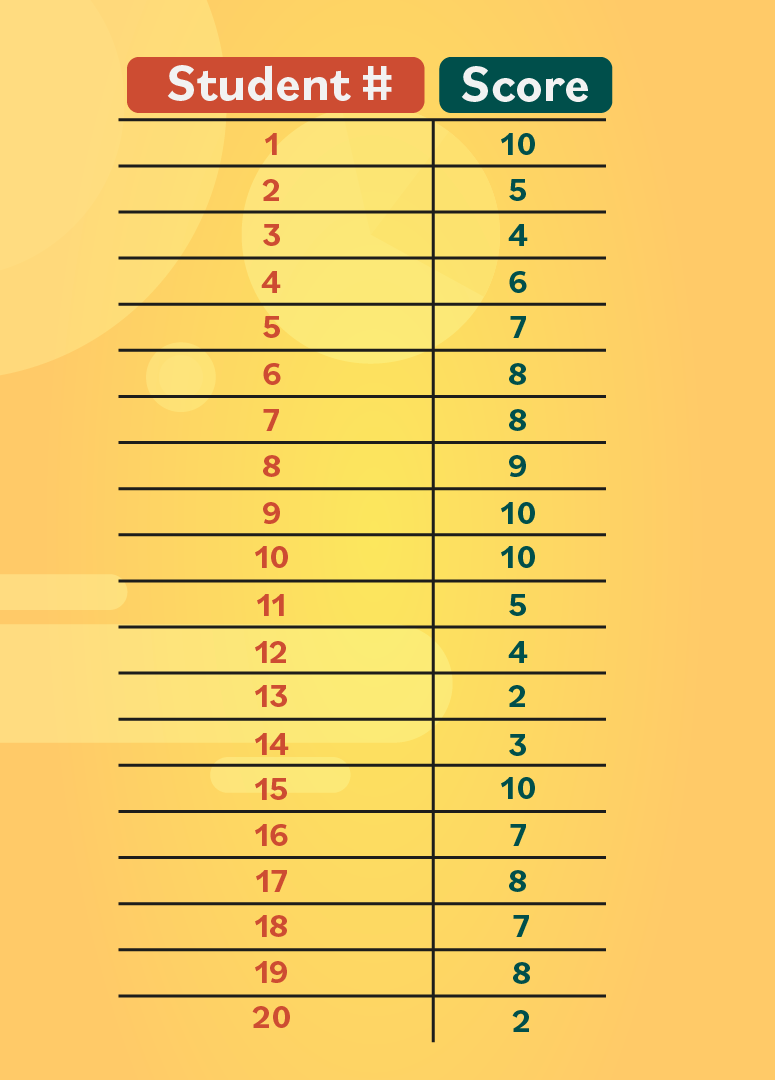
- Step 1: First, the teacher gathers the data. She has assigned the students a number from 1-20 so that the results are anonymous, and then writes down their score.
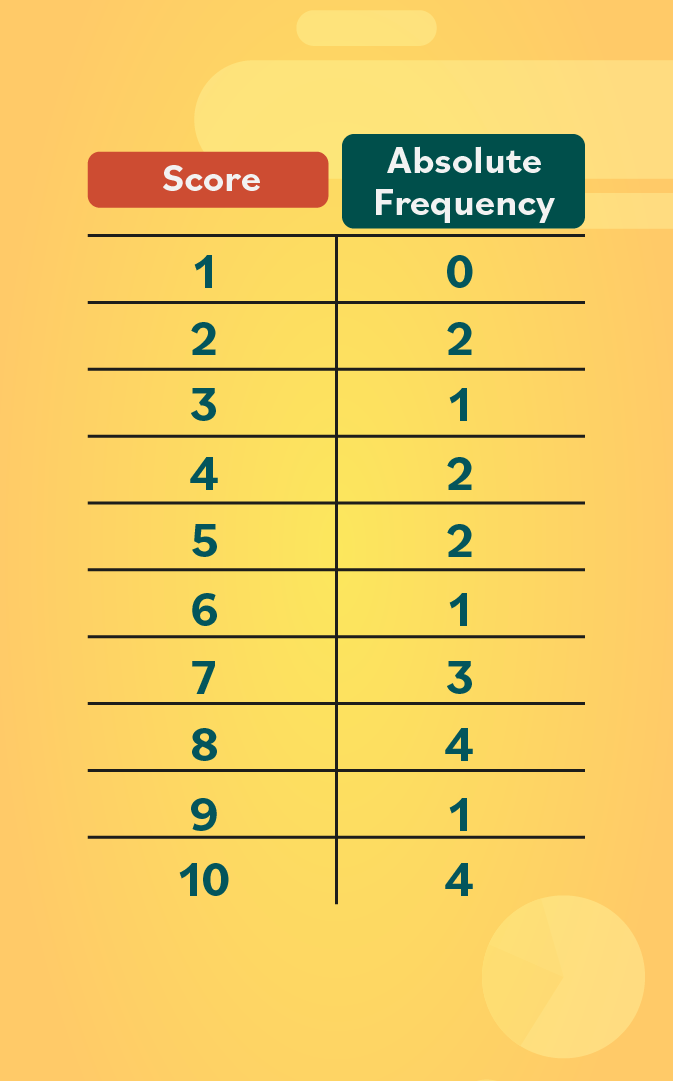
- Step 2: Now she can start creating a table. In the first column, she lists the scores from 1 to 10, from lowest to highest. In the second column, she records the number of times students received this score. These values are the absolute frequency.
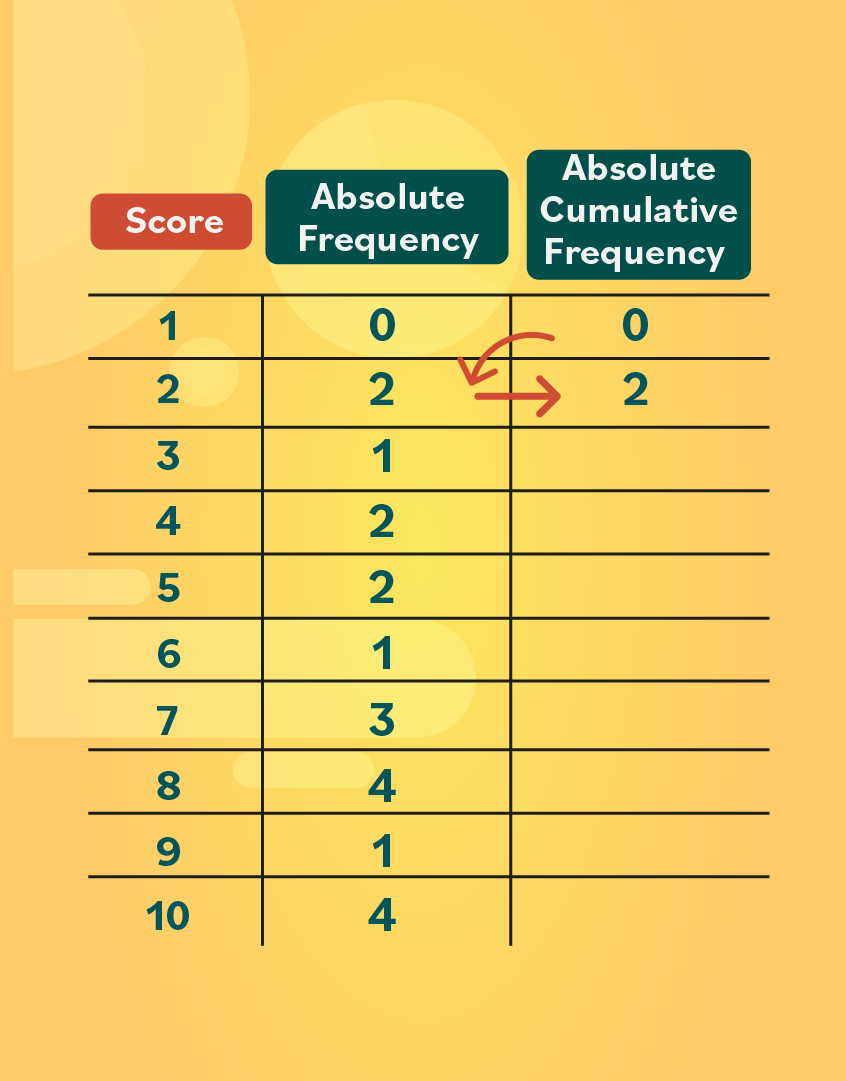
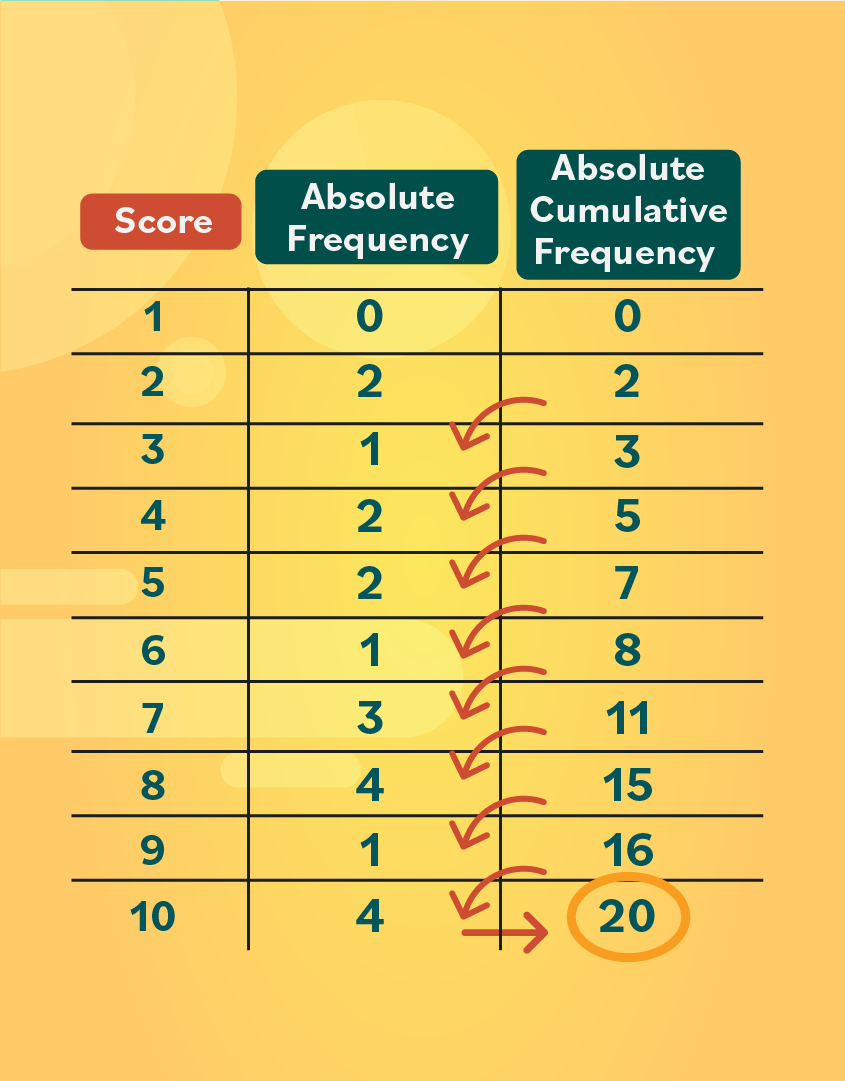
- Step 3: So far she’s put together a simple frequency table, but she can also add one more column to it to calculate the absolute cumulative frequency. This column will help her to see how many students scored below a certain number of points. These values are calculated by adding the data diagonally. For example: the first cumulative value will always be equal to the first absolute frequency listed; in this case, it’s 0. Then, to obtain the second value, add 0 to the second absolute frequency located diagonally in the chart. 0 + 2 = 2.
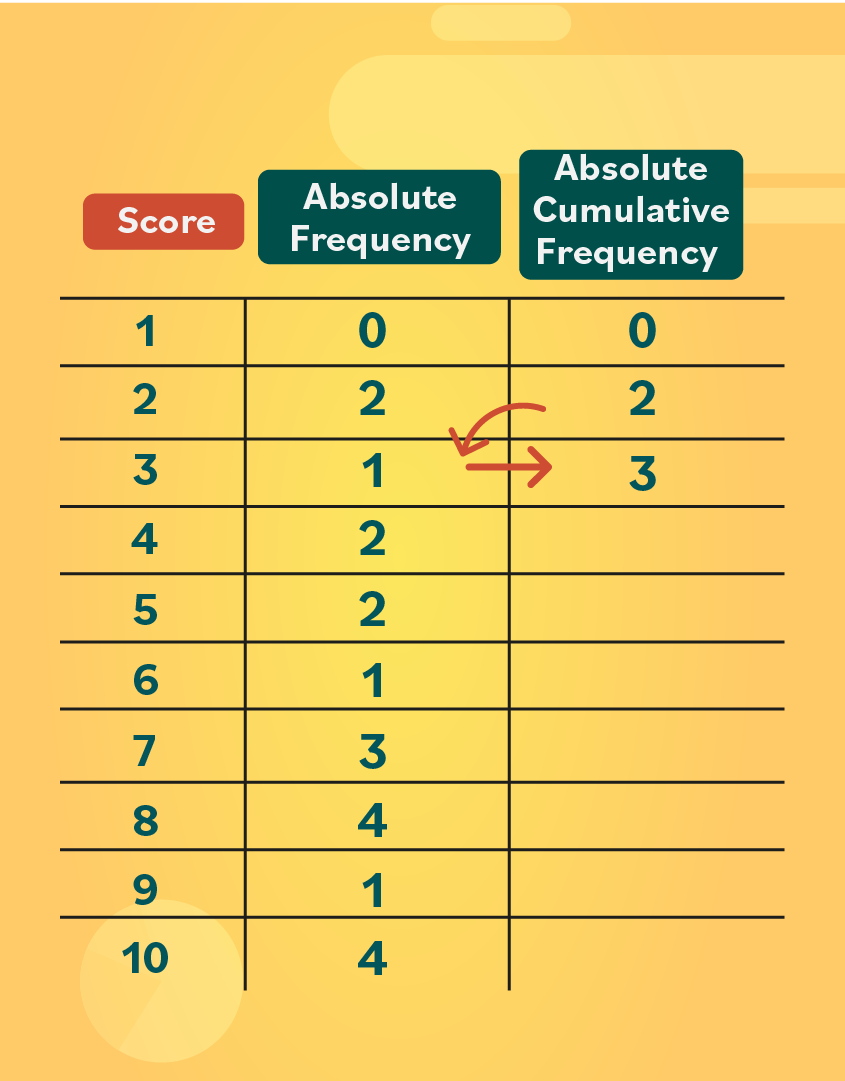
- Step 4: Keep adding the numbers diagonally. 2 + 1 = 3. Continue these additions until the entire column is filled.
- Step 5: One way to verify that the sum is correct is to look at the final number in the absolute cumulative frequency column. In this case, the number is 20–which matches the total number of students in the class.
What does the data show? The teacher can now look at how many students received at or below a particular score. She can do this by comparing the first and third columns (the absolute cumulative frequency and the score). Working backward, 20 students scored a 10 or lower–which makes sense, since this is the highest score they could get.
16 students scored a 9 or lower, 15 scored an 8 or lower, 11 scored a 7 or lower, and so on. Knowing this information can help her to decide whether or not she wants to offer a retake quiz.
Let’s continue working with this data set to see how else the teacher can interpret it.
Relative frequency and cumulative relative frequency
Remember that relative frequency is expressed in percentages. These percentages are useful for showing a frequency’s relationship to the greater whole. For example, what percentage of students received an 8?
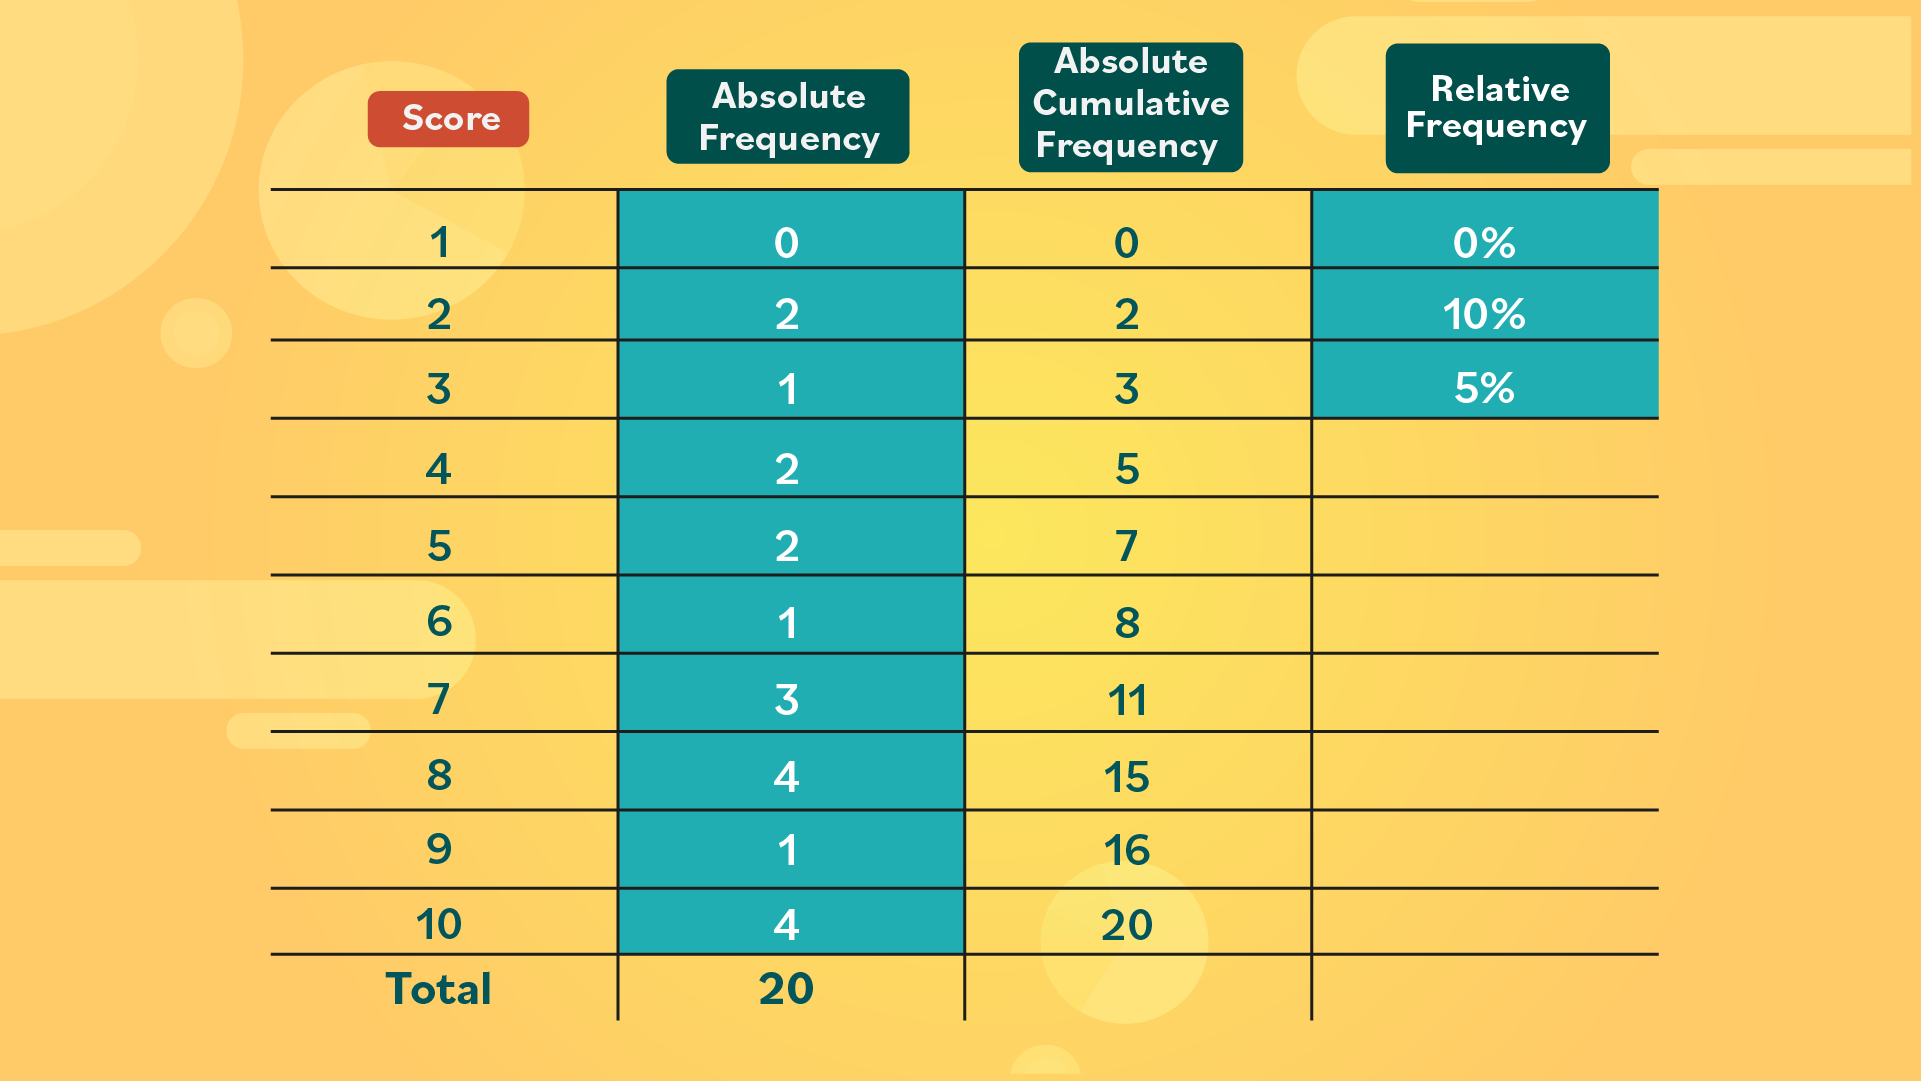
- Step 1: Let’s add a fourth column for relative frequency. Look at the values in the absolute frequency column. Since there are 20 values in total, divide each one by 20. This should result in decimals. For example:
0 ÷ 20 = 0 2 ÷ 20 = 0.1 1 ÷ 20 = 0.05
- Step 2: Now turn each of these decimals into a relative frequency by moving the decimal point two spots to the left. This will give you your percentages. For example:
0% of students received a score of 1.
10% received a score of 2.
5% received a score of 3, and so on.
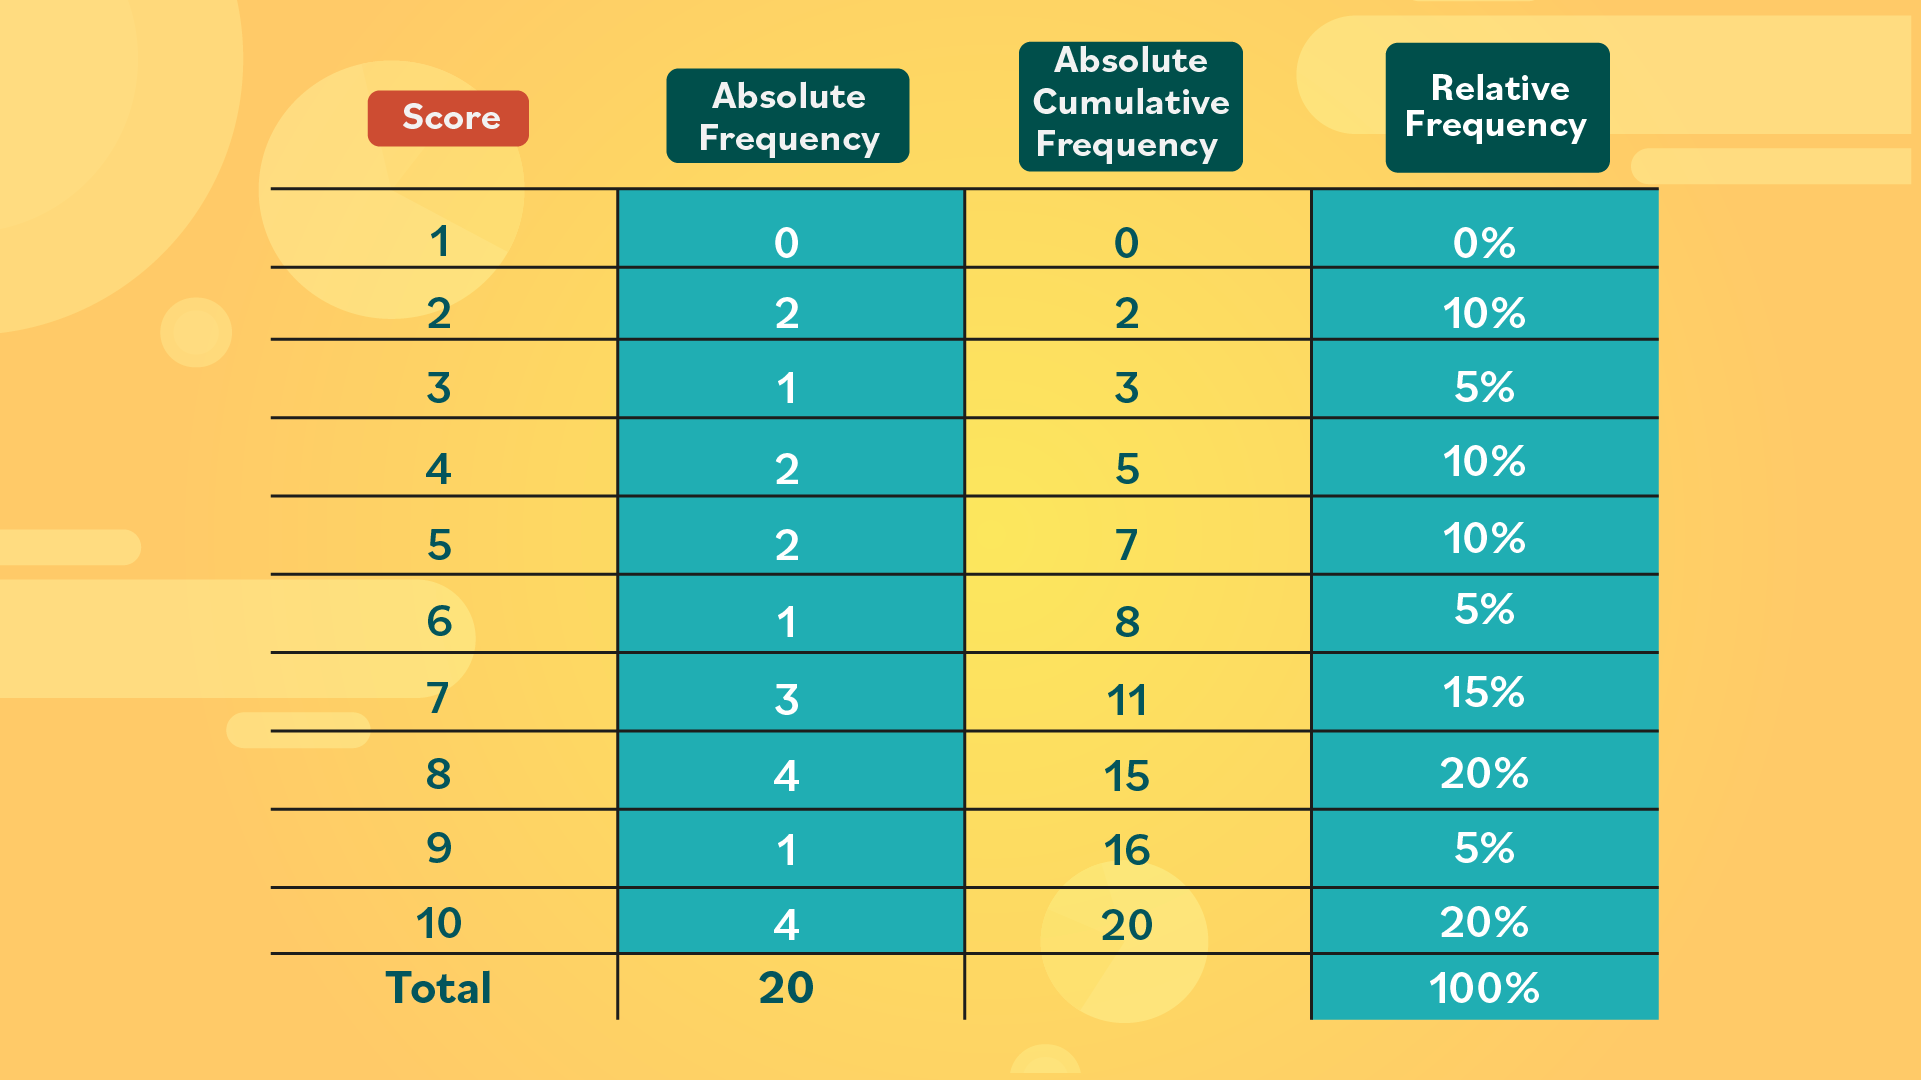
- Step 3: In total, all of the relative frequency percentages should add up to 100%.
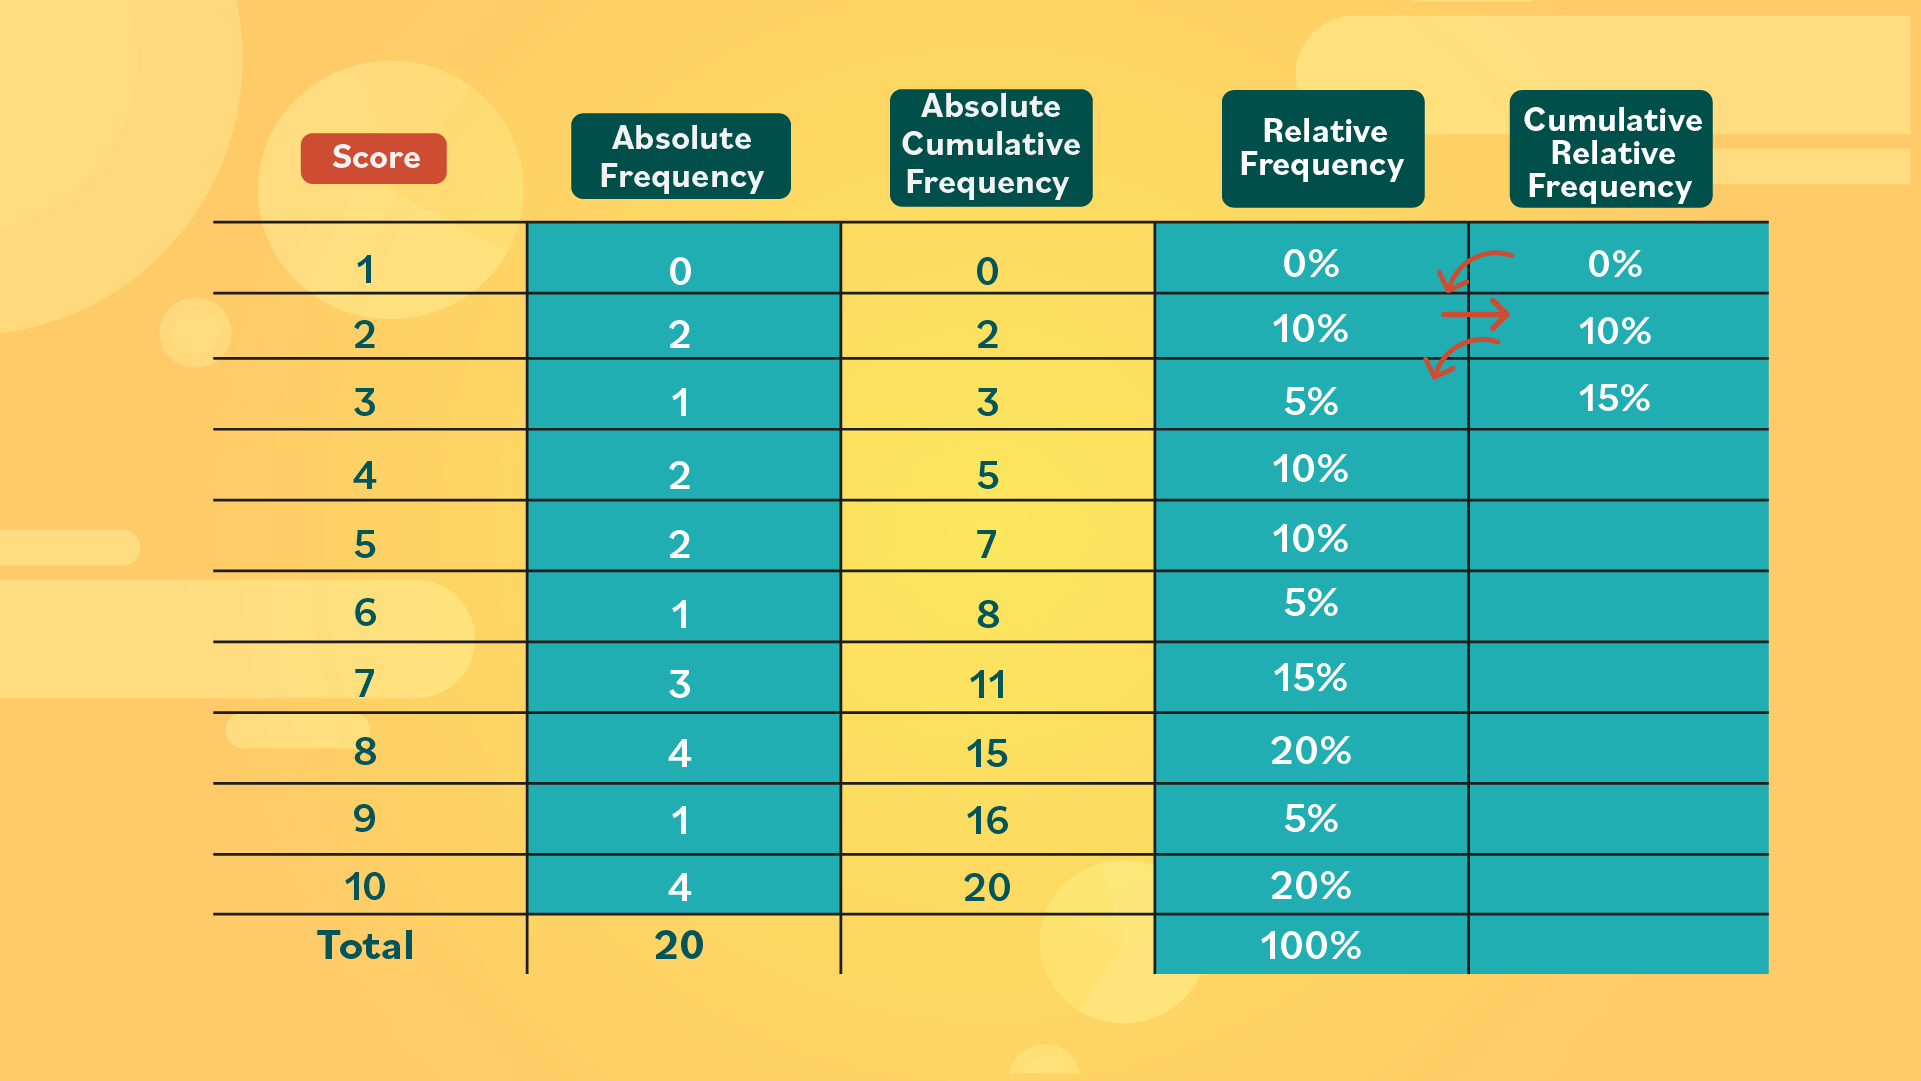
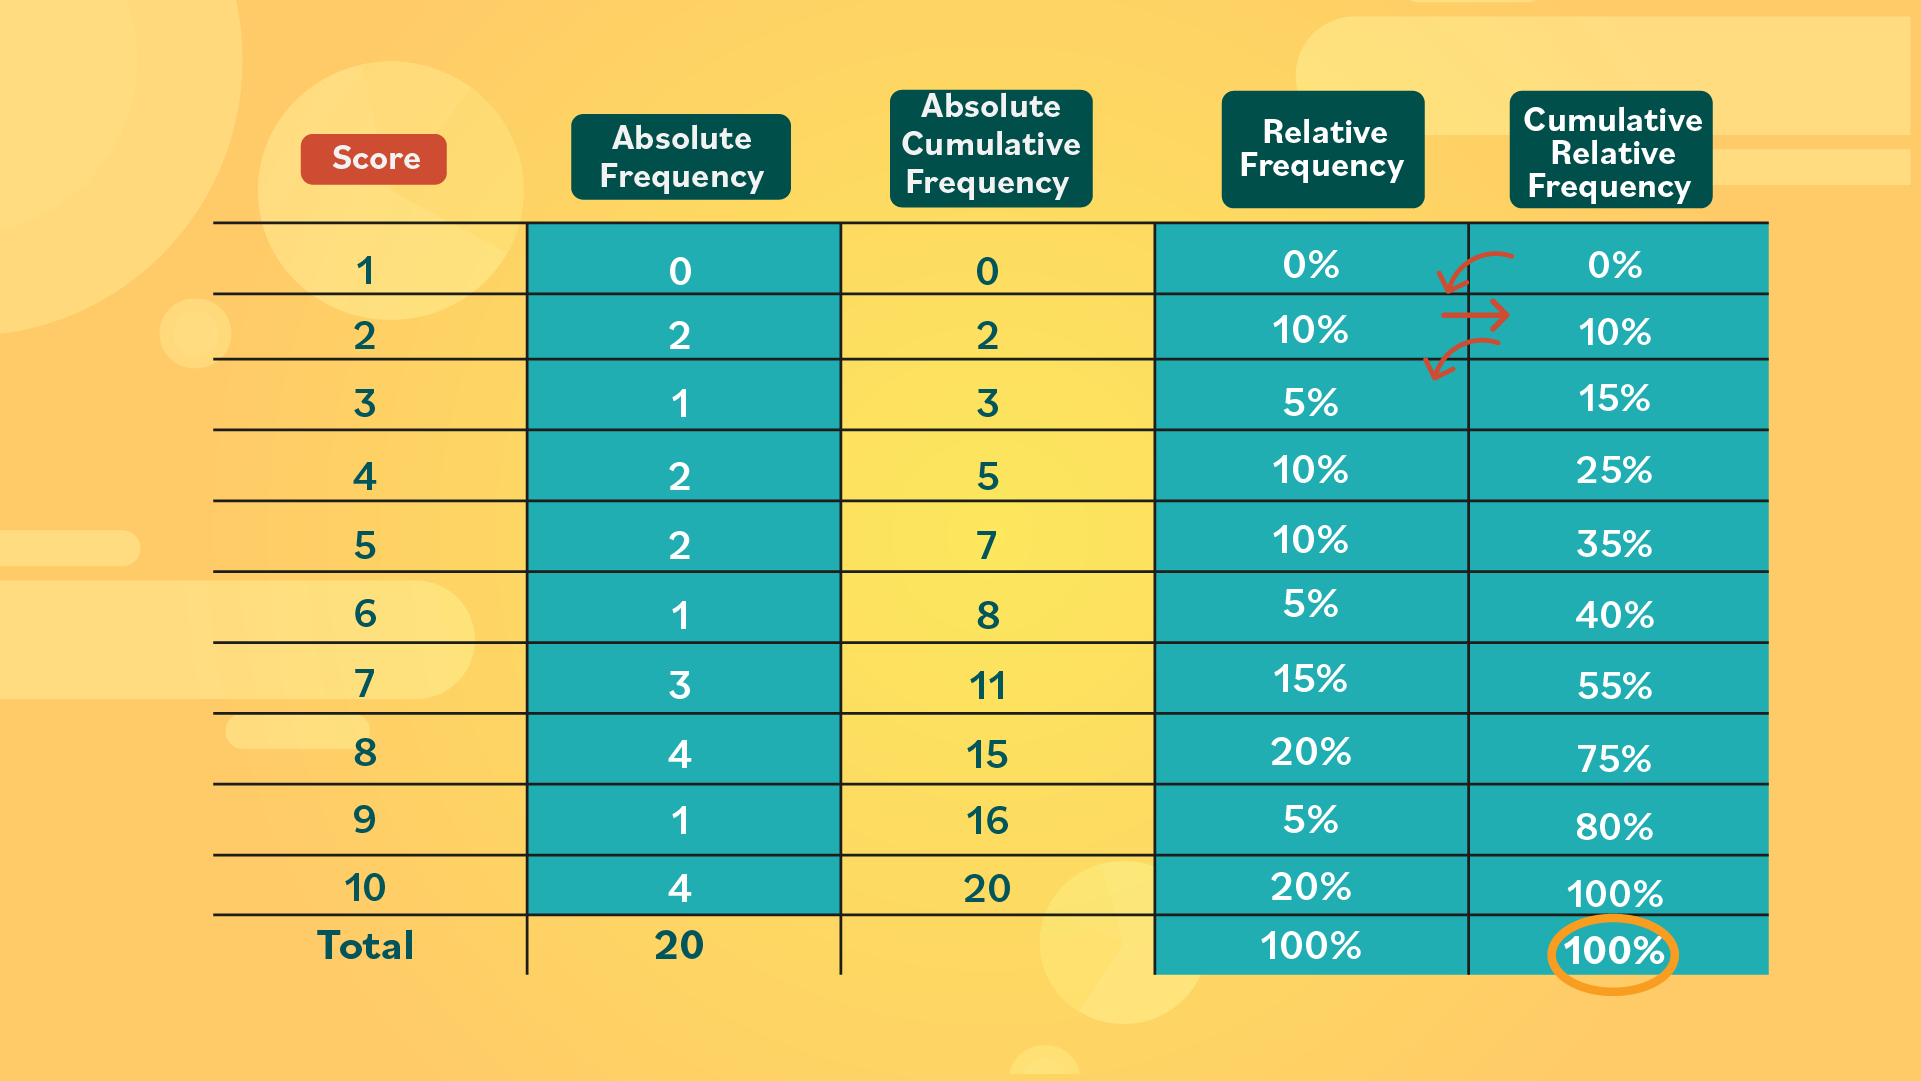
- Step 4: For the cumulative relative frequency, we must add the data diagonally, like we did before. This will show the teacher what percentage of students received at or below a certain score. For example:
0% received a 1.
0% + 10% = 10%, so 10% of students scored a 2 or lower.
10% + 5% = 15%, so 15% of students received a 3 or lower.
- Step 5: By the time you get to the score 10, make sure the cumulative relative frequency adds up to 100%. This will show you that all 20 students are accounted for.
What does the data show? Now the teacher can present the quiz results to her students. She can also decide if they performed well enough on the quiz as a class, or if she should offer a retake.
In conclusion…
Hopefully these steps have clarified how to make your own frequency table. Just remember these four tips:
- Gather your data and organize it.
- Count the number of times a value is repeated in order to determine the absolute frequency.
- Add the values diagonally in order to calculate the absolute cumulative frequency, and the cumulative relative frequency.
- Relative frequency is expressed in percentages.
In the next section of the tutorial, we’ll show you how to present data using different types of graphs.
/en/statistics-basic-concepts/bar-charts/content/