
Statistics: Basic Concepts -
Key Terms

Statistics: Basic Concepts
Key Terms

search
menu
/en/statistics-basic-concepts/what-is-statistics/content/
Let’s discuss the two types of statistics. Then we’ll cover a glossary of key terms you should know, and take a look at an example...
Two types of statistics
It’s important to know that statistics is broken up into two types: descriptive and inferential.
For example, if a researcher wanted to know the average salary of pilots in their country, it might be impossible to ask all of them. What they could do is collect a data sample from a smaller group of pilots. Based on the results, they could then infer or make an educated guess about the pilots' average salary.
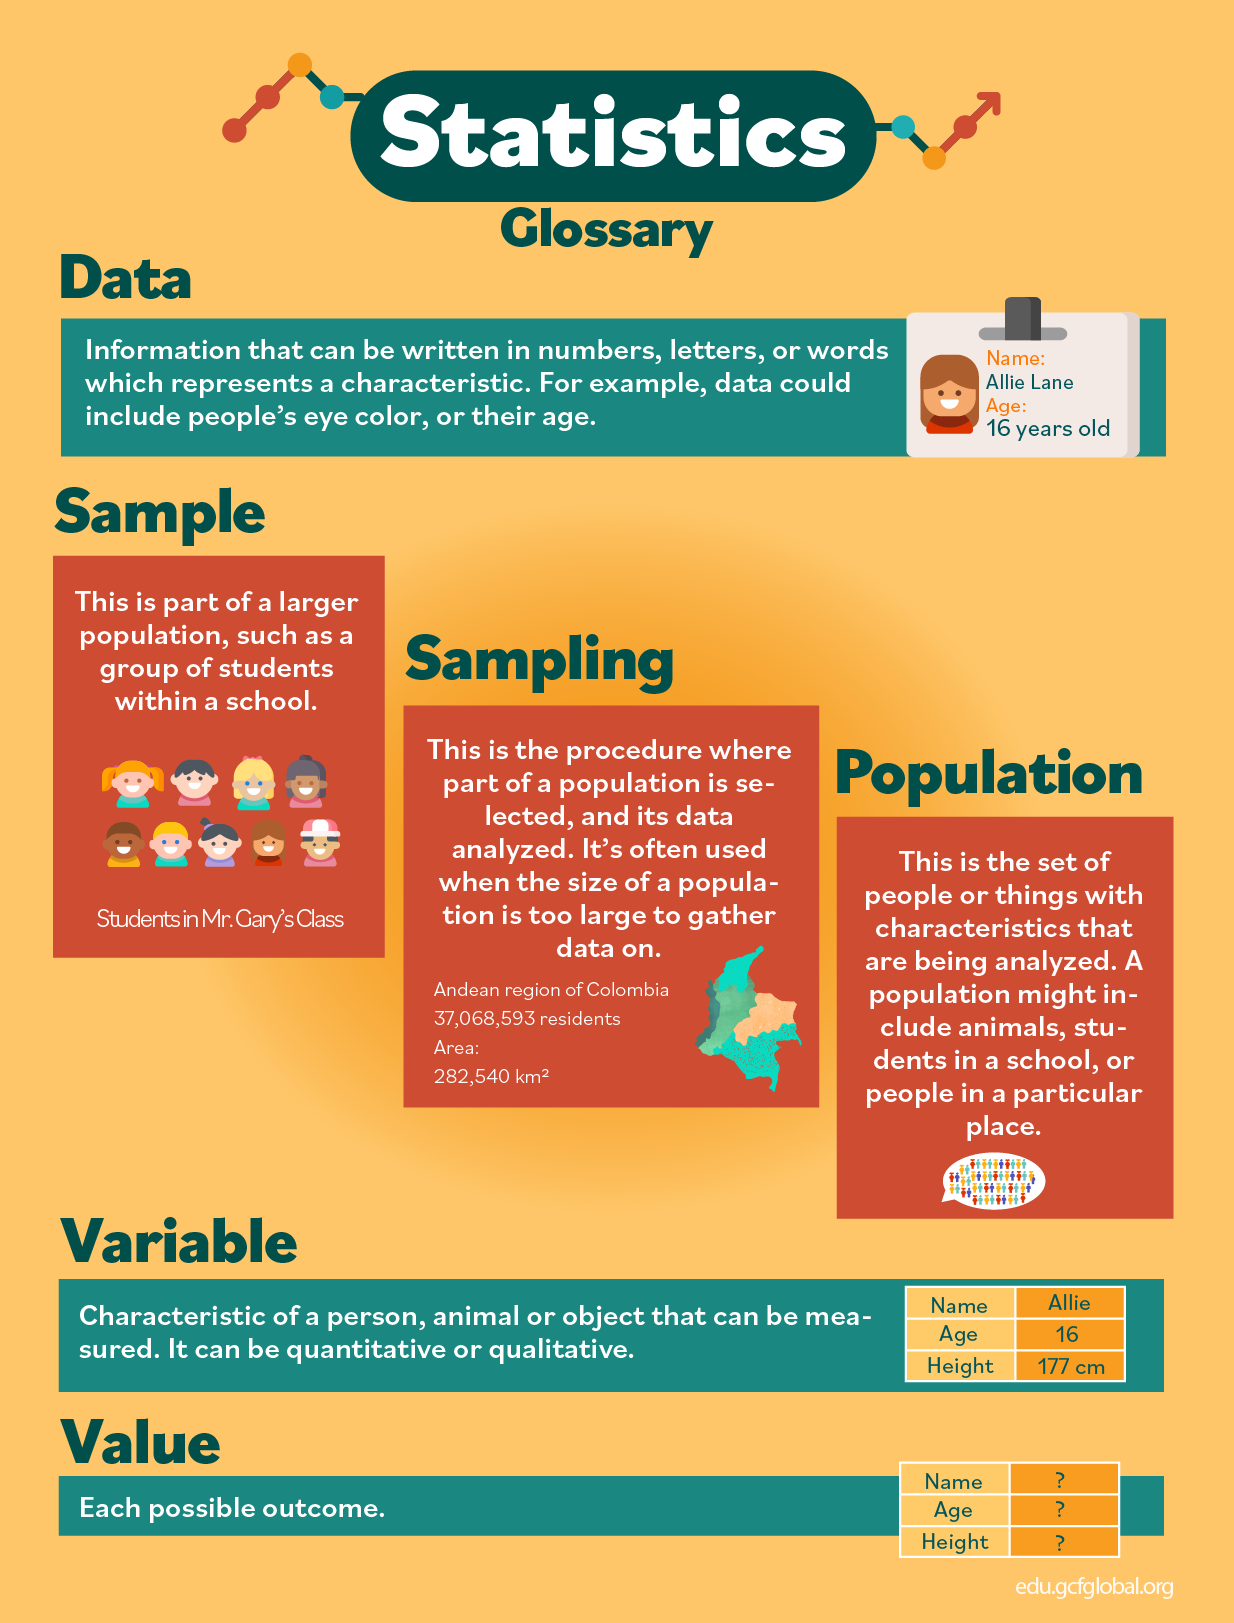
Glossary of key terms
How might you use inferential statistics? Consider this: local elections are being held in your city. The town newspaper wants to predict who will be voted mayor.
Polling the whole population would require a lot of time and money, so the newspaper decides to send out surveys to a sample instead. Then they can analyze the data and infer which candidate might win.
In the next lesson, we’ll start exploring the concept of variables.
/en/statistics-basic-concepts/variables/content/