
Excel 2010 -
Outlining Data

Excel 2010
Outlining Data

search
menu
/en/excel2010/sorting-data/content/
If the amount of data in your worksheet becomes overwhelming, creating an outline can help. Not only does this allow you to organize your data into groups and then show or hide them from view, but it also allows you to summarize data for quick analysis using the Subtotal command (for example, subtotaling the cost of office supplies depending on the type of product).
In this lesson, you will learn how to outline your worksheet in order to summarize and control how your data is displayed.
Outlines give you the ability to group data you may want to show or hide from view, as well as to create a quick summary using the Subtotal command. Because outlines rely on grouping data that is related, you must sort before you can outline. For more information, you may want to review our lesson on Sorting Data.
Optional: You can download this example for extra practice.
The Subtotal command can be used to outline your worksheet in several ways. It uses common functions like SUM, COUNT, and AVERAGE to summarize your data and place it in a group. To learn more about functions, visit our Working with Basic Functions lesson.
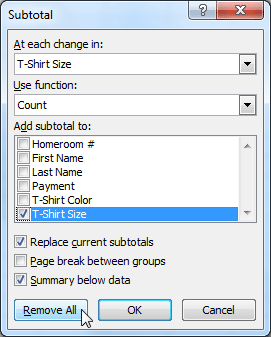
In this example, we'll use the Subtotal command to count the number of T-shirt sizes that were ordered at a local high school. This will also place each T-shirt size in a group, making it possible to show the count but hide the details that are not crucial to placing the order (such as a student's homeroom number and payment date).
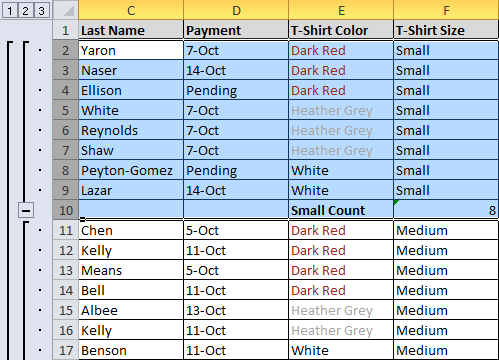
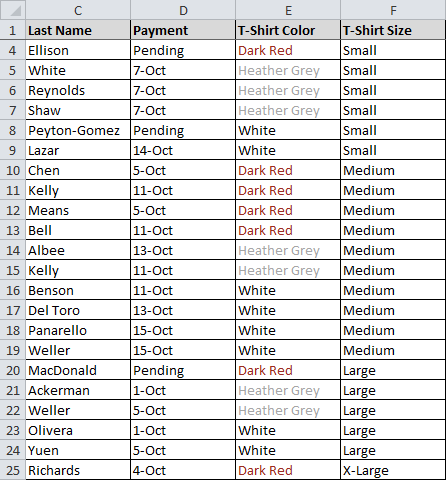 Sorted by T-shirt size
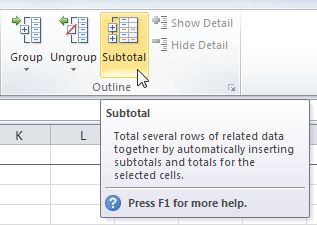 Opening the Subtotal dialog box
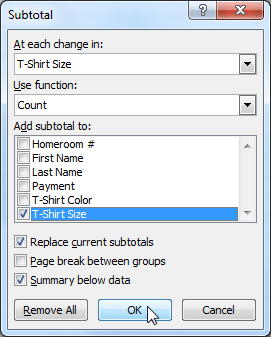 Clicking OK to subtotal
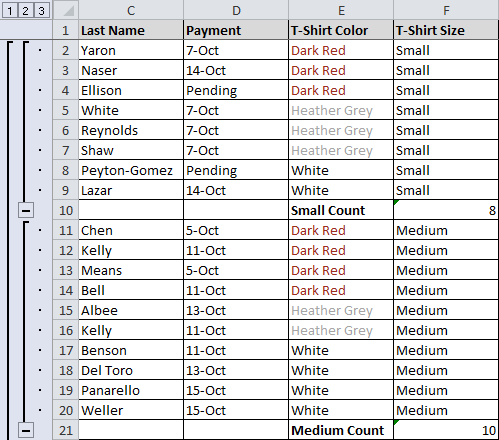 Outlined with subtotal
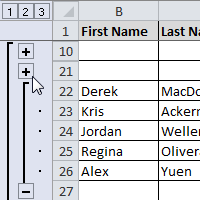
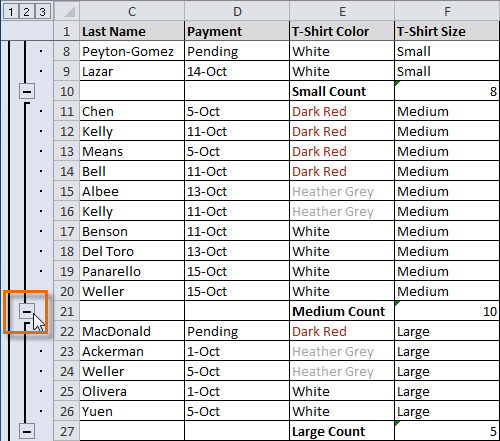 Hiding an expanded group
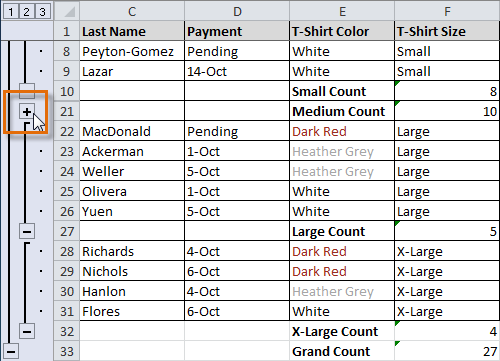 Showing a collapsed group
You can also use the Show and Hide Detail buttons on the Data tab in the Outline group. Select a cell in the group you want to show or hide, then click the appropriate command.
The groups in your outline, based on their hierarchy, are placed on different levels. You can quickly display as little or as much information as you want by clicking the Level buttons to the left of your worksheet. In this example, we will view levels in descending order, starting with the entire worksheet on display, then finishing with the grand total. While this example contains only three levels, Excel can accommodate up to eight.
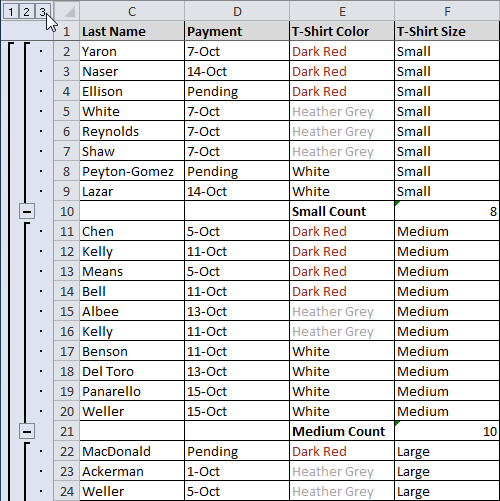 Viewing data at the highest level
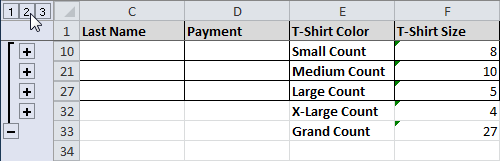 Viewing data on level 2
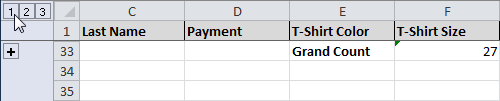 Viewing data on level 1
 Selecting cells to ungroup
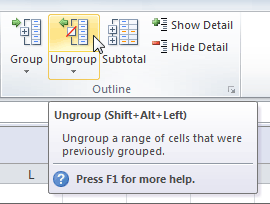 Ungrouping the selected cells
To ungroup all of the groups in your outline, open the drop-down menu under the Ungroup command, then choose Clear Outline.
Ungroup and Clear Outline will not remove subtotaling from your worksheet. Summary or subtotal data will stay in place and continue to function until you remove it.
 Removing groups and subtotaling
 Data without groups or subtotaling
The Group command allows you to group any range of cells—either columns or rows. It does not calculate a subtotal or rely on your data being sorted. This gives you the ability to show or hide any part of your worksheet and display only the information you need.
In this example, we will prepare a list of T-shirt colors and sizes that need to be distributed to each homeroom. Some of the data in the worksheet is not relevant to the distribution of T-shirts; however, instead of deleting it, we'll group it, then temporarily hide it from view.
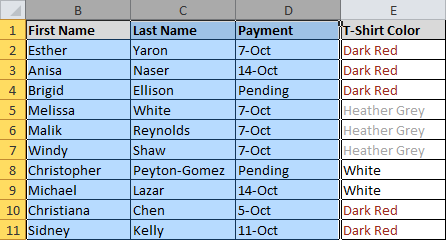 Selecting a range of cells to group
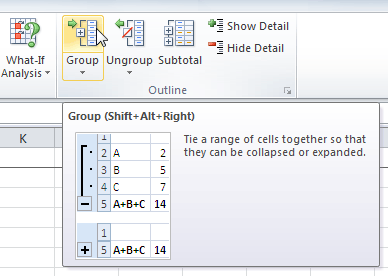 Grouping the selected cells
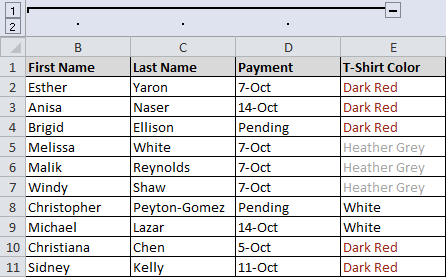 Grouped cells
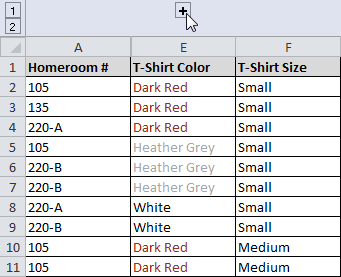 Click to show a hidden group
Click the plus sign—also known as the Show Detail symbol—to show the group again.
/en/excel2010/filtering-data/content/